Compare
A hosted Netdata alternative for Linux servers
Last updated
Monitorable is a hosted server-monitoring service for Linux servers: one open-source OpenTelemetry agent per server, a dashboard with alerting, flat monthly pricing, and nothing to host.
This page is for people running the free Netdata agent on Linux servers who would rather not operate monitoring themselves: a dashboard per node or a Parent to keep running, a stock alert set to tune to your hosts, and a Parent dashboard that everyone shares as one user unless Netdata Cloud or your own authentication sits in front of it. It is also for Netdata Cloud Business users looking at a per-node bill.
Switching to Monitorable means one command per server installs a standard OpenTelemetry Collector agent, the dashboard and alerting are hosted, a default set of alert rules is on from the first minute, and the price is a flat amount per plan rather than per node. You give up per-second resolution (Netdata's default for most sources; Monitorable reports once a minute), Netdata's per-process and application collectors, Windows and macOS hosts, Kubernetes pod metrics and the option to self-host. Monitorable is Linux only, lets the dashboard look back 15 to 365 days by plan, and does not do uptime checks or status pages.
At a glance
| Netdata | Monitorable | |
|---|---|---|
| Hosting model | Agent on every node. The dashboard is served by each node, by a Parent you run, or by Netdata Cloud. | Hosted. Nothing to run except the agent. |
| What you run per server | The open-source Netdata agent, with its metrics database and dashboard on the node. | One open-source OpenTelemetry Collector agent as a systemd service, outbound HTTPS only. It never reads logs or file contents. |
| Metrics covered | Hundreds of collectors: host, processes, applications, containers, Kubernetes and more; per-second by default for most metrics, 5 to 10 seconds for slower sources. | Host CPU, memory, disk, network, Docker containers, systemd services, SMART disk health, temperatures and listening ports, once a minute. |
| Alerting | More than 1,100 stock alert definitions with hysteresis, delays and repeat intervals, edited per agent or Parent; notifications from the agent or Netdata Cloud. | Default rules on from the first minute, edited in a template in the dashboard. Thresholds averaged over a window, reminders capped per rule, a flapping condition stays one incident. Email, Telegram, Discord, Slack, PagerDuty, ntfy, Webhook. |
| Team access | A Parent's dashboard is shared with anyone who can reach it; user accounts, roles and rooms need Netdata Cloud (Community: up to 5 nodes, non-commercial use). | Organizations with members and roles; 1 to 25 team members by plan. |
| History | Tiered on each node: per-second 14 days, per-minute 3 months, hourly 2 years by default, 1 GiB per tier, configurable. | Dashboard window 15 to 365 days by plan; underneath, per-minute data for 35 days and hourly summaries for 400 days. |
| Free tier | The agent is free and open source. Netdata Cloud Community is free for up to 5 nodes, non-commercial use. | Lite: 3 servers, 15 days of history, no card, no time limit. |
| Price for 10 servers / year | $540 (Business, commercial use) | $90 (Pro) |
| Price for 40 servers / year | $2,160 (Business, commercial use) | $290 (Scale) |
Which one to pick
Pick Netdata if…
- You want per-second metrics (Netdata's default for most sources) and to zoom into the last few minutes of a node in detail.
- You need per-process and application collectors (databases, web servers, queues, and hundreds more) out of the box.
- You monitor Windows or macOS hosts, or Kubernetes pods.
- You want to self-host everything and keep the metrics on the node.
- You have up to 5 nodes and non-commercial use, which Netdata Cloud Community covers for free.
Pick Monitorable if…
- You want nothing to host: no Parent, no database to size, no dashboard to keep up to date.
- You want one command per server and a standard, open-source OpenTelemetry Collector agent that never reads logs or file contents.
- You want a flat price per plan rather than a per-node bill.
- You want alerting that is on from the first minute and built to stay unmuted: thresholds averaged over a window, reminders capped per rule, a flapping condition stays one incident, rules edited in a template in the dashboard rather than on each server.
- You want 3 servers free forever, no card.
What each one measures
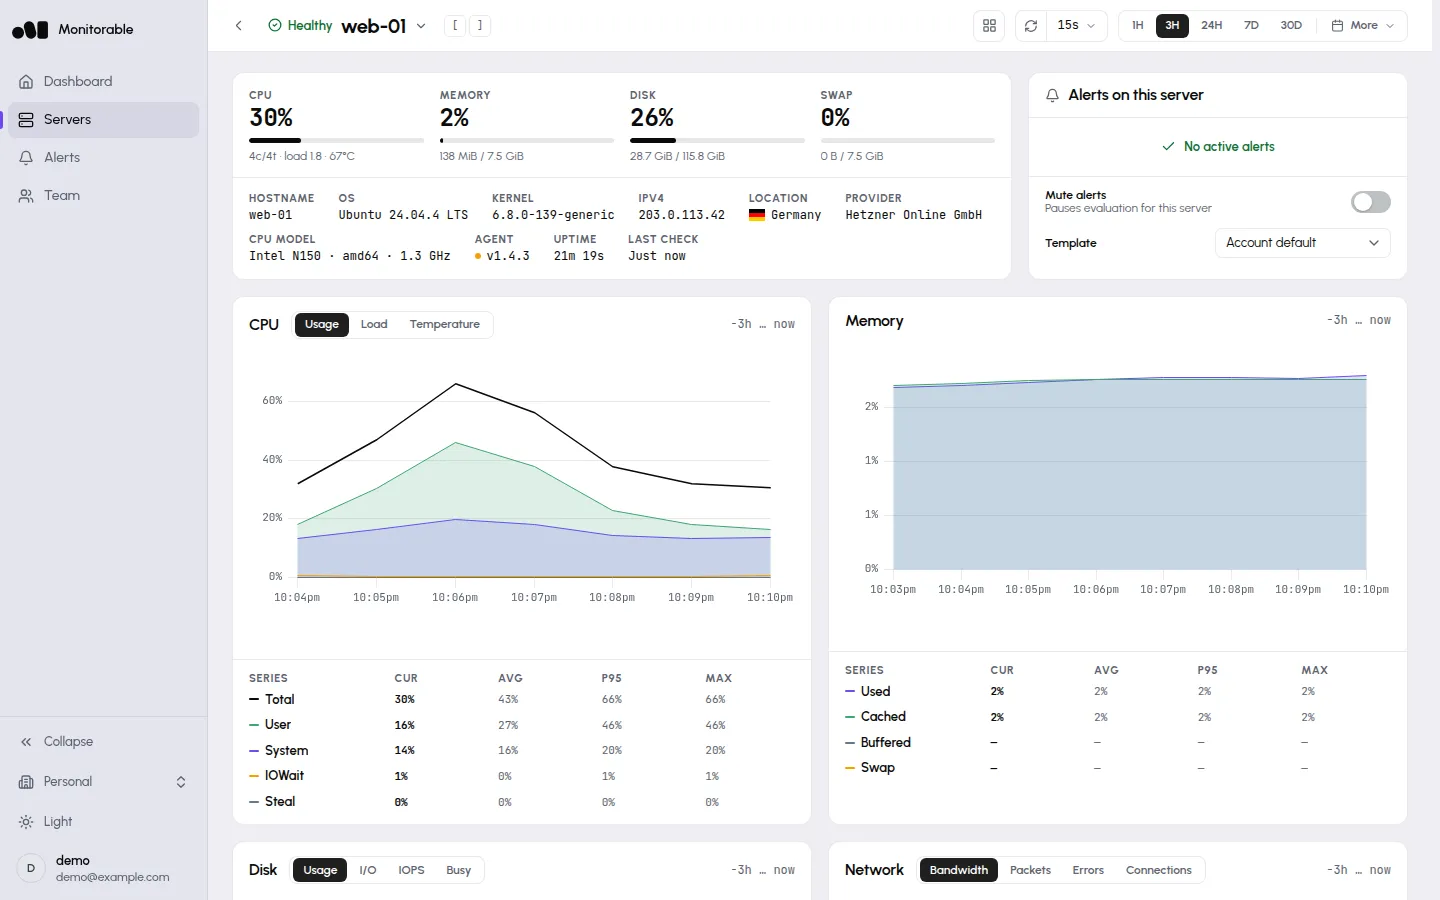
Netdata measures more things at a finer resolution; Monitorable covers the host, its containers, services and disks once a minute, hosted.
Netdata. Netdata ships hundreds of collectors covering the host, processes, applications, containers, Kubernetes and more, at per-second resolution by default for most metrics (slower sources every 5 to 10 seconds), with the data kept on the node or on a Parent you run.
Monitorable. Monitorable reports host CPU, memory, disk, network, Docker containers, systemd services, SMART disk health, temperatures and listening TCP ports once a minute from a single agent. It does not report per-process or Kubernetes pod metrics, and it collects no logs, traces or file contents.
Running it
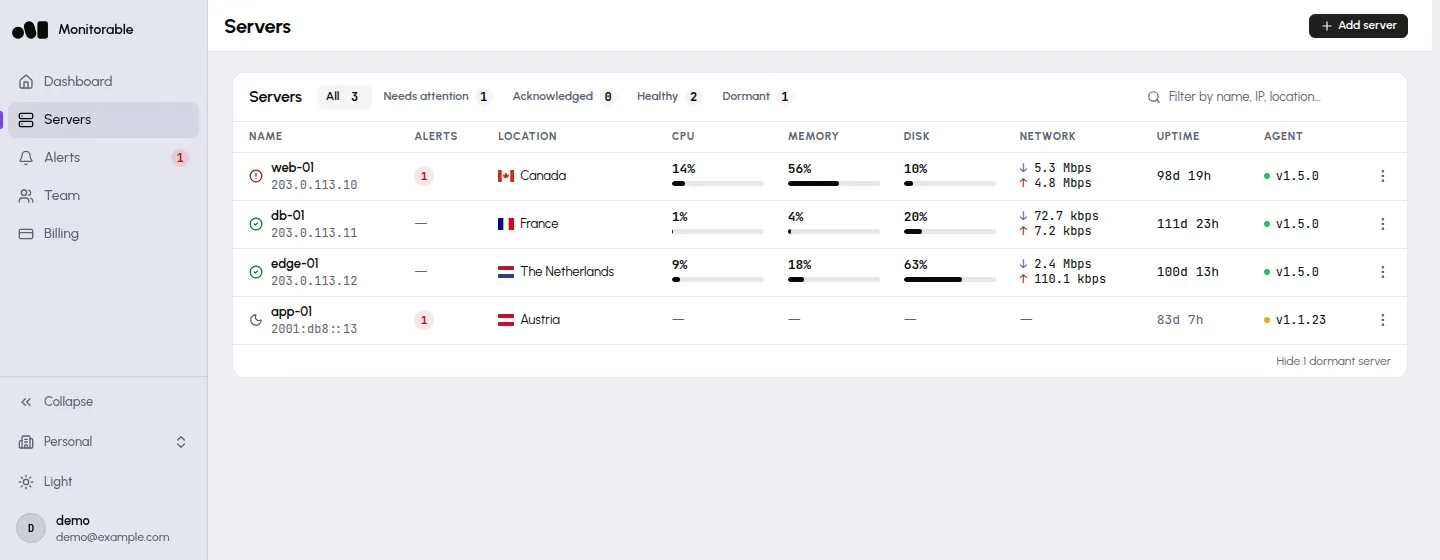
Self-hosted Netdata leaves you a Parent and its access control to run; Monitorable leaves you one agent per server and a URL.
Netdata. Install the Netdata agent on every node. Each node serves its own dashboard; for one view across nodes you run a Parent that the children stream to, or connect the nodes to Netdata Cloud. Out of the box that dashboard has no login, so reaching it from outside means binding it to a private interface, a reverse proxy with its own authentication, or a Netdata Cloud sign-in. Retention is configured per node and lives on that node's disk.
Monitorable. One command installs the agent as a systemd service. It reports once a minute over outbound HTTPS, opens no inbound ports, accepts no remote commands and never reads logs or file contents. Dashboard, storage and alerting are hosted; there is nothing else to run.
What you stop running when you switch
- Netdata. A Parent to size, patch and back up, with a retention strategy per tier (time-based or space-based) and the disk to match. source
Monitorable. Nothing. Storage is sized, backed up and operated for you; the dashboard is a URL. - Netdata. Access control in front of the dashboard: a private binding, a reverse proxy with its own authentication, or claiming the node or its Parent to Netdata Cloud for sign-in. source
Monitorable. Sign in with GitHub, Google or an email link; organizations with members and roles are built in. - Netdata. Alert overrides maintained per agent or Parent, in configuration files or the UI configuration manager. source
Monitorable. Rules are edited in a template in the dashboard, and a template applies to every server assigned to it. - Netdata. Disk and retention arithmetic per node: three tiers, each with its own retention and size cap. source
Monitorable. One fixed story: per-minute data for 35 days, hourly summaries for 400 days, and a plan that sets how far back the dashboard looks.
Alerting
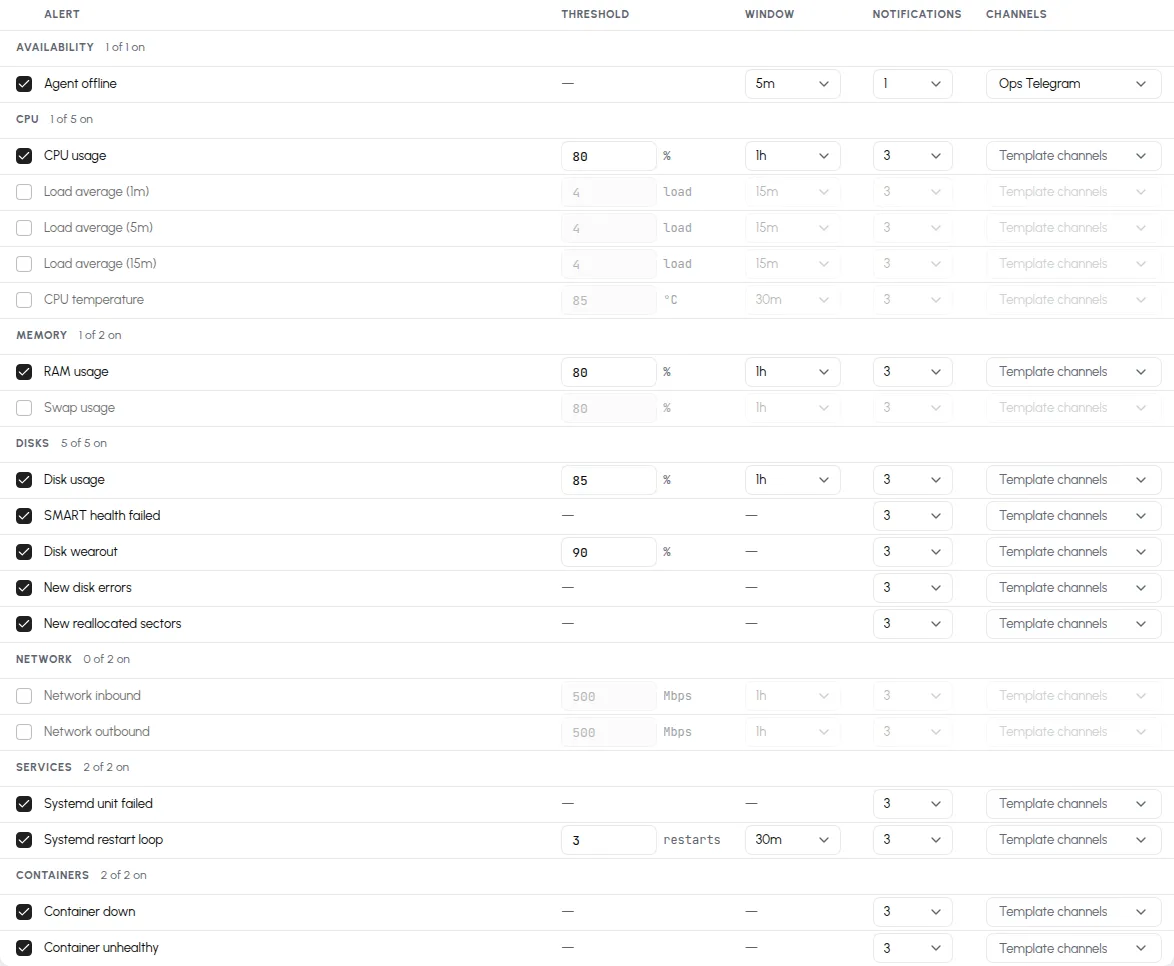
Netdata starts from a large stock set tuned per agent or Parent; Monitorable starts from a default template edited in the dashboard.
Netdata. Netdata ships more than 1,100 stock alert definitions that activate for what the agent detects, with hysteresis, delays, repeat intervals and flood protection. Alerts are edited per agent or Parent, in configuration files or the UI configuration manager. Notifications go out through 30 methods from the agent or 16 integrations from Netdata Cloud, which adds silencing rules and, on paid plans, mobile push.
Monitorable. A default set of rules is on from the first minute, with your sign-in email as the first channel. Thresholds are averaged over a window and need two checks in a row, so a single spike sends nothing. Reminders are capped per rule, a flapping condition stays one incident, a restart loop is one incident, alerts resolve themselves when the condition clears, and an agent that goes silent is itself an alert after five minutes. Rules are edited in a template in the dashboard, and a template applies to every server assigned to it.
Pricing, as of 26 October 2026
Netdata Cloud Business bills per node; Monitorable bills a flat price per plan.
Netdata plans as listed on Netdata's pricing page on 2026-10-26.
| Netdata plan | Price | Terms |
|---|---|---|
| Community | Free | Netdata Cloud, up to 5 active connected nodes, non-commercial use, 1 custom dashboard per room. |
| Homelab | $90/year | Unlimited nodes under a fair-usage policy, for enthusiasts, non-commercial use. |
| Business | $4.50/node/month | Each Netdata Agent is a billable node; containers on a monitored host come at no extra cost; no charge for data retention. |
| Enterprise | Contact | From 200 node licences. |
Monitorable plans. The price covers the whole plan, not each server. Running more than 150 servers? Email hello@monitorable.io.
| Monitorable plan | Price | Servers | History |
|---|---|---|---|
| Lite | Free | up to 3 | 15 days |
| Pro | $9/month or $90/year | up to 10 | 30 days |
| Scale | $29/month or $290/year | up to 40 | 90 days |
| Enterprise | $79/month or $790/year | up to 150 | 365 days |
Yearly total for a fleet, paid annually where an annual price exists.
| Fleet | Netdata | Monitorable |
|---|---|---|
| 10 servers | $540/year Business, commercial use | $90/year Pro |
| 40 servers | $2,160/year Business, commercial use | $290/year Scale |
The totals are for commercial use. For a non-commercial fleet, Netdata Homelab is $90/year for unlimited nodes under a fair-usage policy.
What Monitorable does not do
- No uptime or HTTP checks and no status pages. Monitorable only sees what the agent reports from inside the server. Pair it with Uptime Kuma (self-hosted) or Hyperping (hosted) for checks and a status page.
- Linux only. No Windows, macOS or BSD agent.
- No per-process or Kubernetes pod metrics. Monitorable reports at host, Docker container, systemd service and disk level. Pair it with Netdata or Grafana Cloud for processes and pods.
- No logs, traces or application performance monitoring.
- Metric history: the dashboard window is 15 to 365 days by plan; underneath, per-minute data is kept for 35 days and hourly summaries for 400 days. Capacity planning over years wants a metrics store you operate.
- The agent reports once a minute and "Agent offline" fires after five minutes by default. Detection in seconds is an uptime checker's job.
Monitorable vs Netdata
Is Monitorable a drop-in replacement for Netdata?
No. It replaces the host, container and service monitoring most teams use Netdata for, with hosting and alerting included. It does not replace per-process, application or Kubernetes metrics, nor per-second resolution (Netdata's default for most sources).
Can I run Netdata and Monitorable on the same server?
Yes. The Monitorable agent is an OpenTelemetry Collector running as its own systemd service and does not interfere with the Netdata agent. Keeping Netdata on a node for local high-resolution debugging and using Monitorable for the fleet view and alerting is a reasonable setup.
What do I stop running if I switch?
The Parent and its disk, the access control in front of the dashboard, and the per-node alert and retention configuration; the agent stays, as one systemd service. The section "What you stop running when you switch" above lists each item with the Netdata documentation page that describes it.
Which is cheaper?
For a few nodes, both have a free tier: Netdata Cloud Community for up to 5 nodes (non-commercial) and Monitorable Lite for 3 servers. For a non-commercial fleet of any size, Netdata Homelab is $90/year. For commercial use above the free tiers, Netdata Business bills per node and Monitorable bills a flat price per plan; the pricing table on this page shows both at 10 and 40 servers as of 2026-10-26.
What does the Monitorable agent read on the server?
Host metrics and temperatures from the kernel, Docker through its socket, systemd over D-Bus, SMART from the disks and the list of listening TCP ports. It never reads logs, file contents, process lists, command lines or environment variables, and it sends everything out over HTTPS.
Does Monitorable keep the data longer than Netdata?
No. Netdata's defaults keep per-second data for 14 days, per-minute data for 3 months and hourly data for 2 years on each node; Monitorable keeps per-minute data for 35 days and hourly summaries for 400 days, and each plan sets how far back the dashboard queries (15 to 365 days). What you get instead is storage that is sized, backed up and operated for you.
Checked on 2026-10-26. Spotted a change? hello@monitorable.io.
Sources:
- https://learn.netdata.cloud/docs/welcome-to-netdata
- https://learn.netdata.cloud/docs/netdata-parents/metrics-centralization-points
- https://learn.netdata.cloud/docs/netdata-cloud
- https://learn.netdata.cloud/docs/welcome-to-netdata/complete-product-description
- https://learn.netdata.cloud/docs/netdata-agent/database
- https://learn.netdata.cloud/docs/netdata-parents/parent-configuration-best-practices
- https://learn.netdata.cloud/docs/netdata-agent/configuration/securing-agents
- https://learn.netdata.cloud/docs/alerts-&-notifications/alert-configuration-reference
- https://www.netdata.cloud/pricing/
Try it on one server
Sign in, add a server, and run the command it gives you. 3 servers free, no card.
curl --proto '=https' --tlsv1.2 -fsSL https://get.monitorable.net/install.sh | sudo sh -s -- --api-key=<key>